ggplot2 layers for H.T. Odum’s Energy Systems Language

energese provides ggplot2 layers for H.T. Odum’s Energy Systems Language (ESL) — also known as Energese, Energy Circuit Language, or Generic Systems Symbols — a visual vocabulary of ten canonical symbols that Howard T. Odum developed in the 1950s during tropical-forest studies at El Verde, Puerto Rico (Odum & Pigeon 1970, funded by the U.S. Atomic Energy Commission) and formalised in later systems-ecology work. See the Wikipedia article for a general introduction.
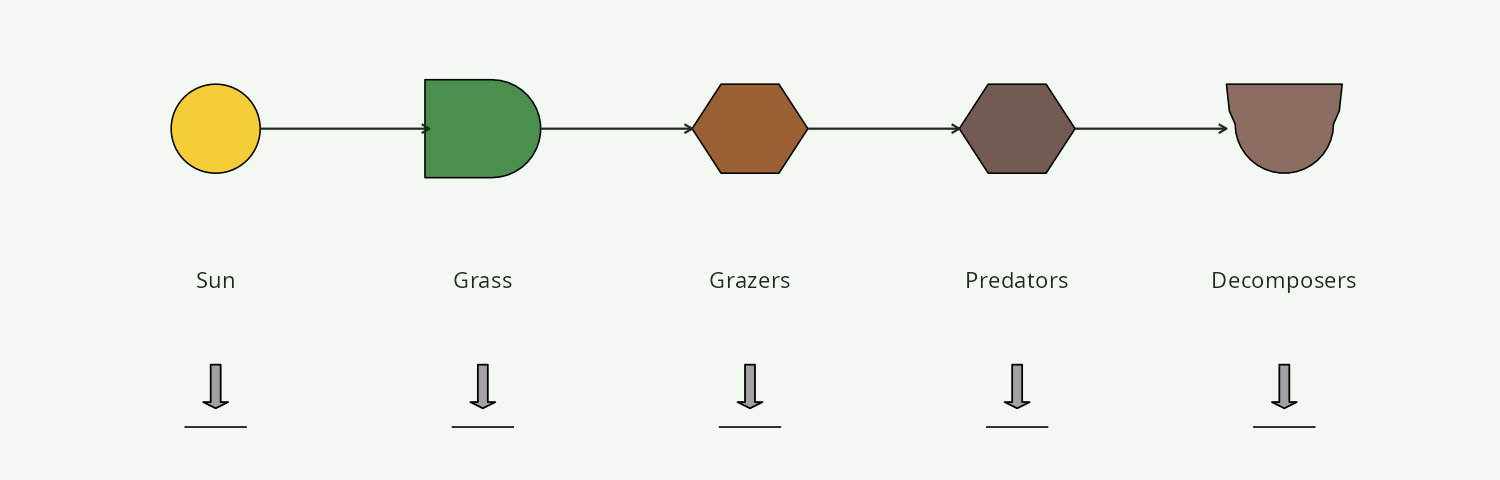
Every canonical ESL symbol on Wikipedia’s Energese reference chart is exposed as a proper ggplot2 layer:

| Symbol | Purpose | Function |
|---|---|---|
| Circle | Source (renewable / external input) | geom_odum_source() |
| Arrow | Generic flow | geom_odum_flow() |
| Bertalanffy module | Storage (flat top, rounded bottom) | geom_odum_storage() |
| Hexagon | Consumer | geom_odum_consumer() |
| Chevron | Interaction (multiplicative junction) | geom_odum_interaction() |
| Bullet | Autocatalytic producer | geom_odum_producer() |
| Bowtie | Switch (on/off logic gate) | geom_odum_switch() |
| Semi-circle | Self-limiter (saturating unit) | geom_odum_self_limiter() |
| Down-arrow + line | Heat sink (dispersed energy) | geom_odum_heat_sink() |
| Elongated diamond | Money transaction | geom_odum_transaction() |
Each takes standard ggplot2 aesthetics (x, y, fill, colour, alpha, linewidth) plus a geometry aesthetic (width + height for polygonal symbols, radius for circular ones), is vectorised over rows of data, and composes naturally with ggplot(), facet_*(), gganimate, patchwork, etc.
Installation
# CRAN (once accepted)
install.packages("energese")

# Development version
# install.packages("remotes")
remotes::install_github("ericscheier/energese")
Reproducing the Wikipedia Energese chart
The package ships with plot_energese_reference() — a single function that draws every canonical Odum ESL symbol in the same top-to-bottom layout as Wikipedia’s reference chart. This is the “does the package actually let you produce these diagrams” proof:
Composing a small diagram
library(ggplot2)
library(energese)

d <- data.frame(
  x    = c(0, 3, 6, 9, 12, 15, 18, 21, 24, 27),
  y    = 0,
  role = c("source", "flow", "storage", "consumer", "interaction",
           "producer", "switch", "self_limiter", "heat_sink",
           "transaction"))

ggplot(d, aes(x = x, y = y)) +
  geom_odum_source     (data = d[1, ],  radius = 0.6) +
  geom_odum_flow       (data = d[2, ],  width = 1.5, height = 0.8) +
  geom_odum_storage    (data = d[3, ],  width = 1.5, height = 1.2) +
  geom_odum_consumer   (data = d[4, ],  width = 1.5, height = 1.0) +
  geom_odum_interaction(data = d[5, ],  width = 1.5, height = 1.0) +
  geom_odum_producer   (data = d[6, ],  width = 1.5, height = 1.0) +
  geom_odum_switch     (data = d[7, ],  width = 1.0, height = 1.0) +
  geom_odum_self_limiter(data = d[8, ], width = 0.8, height = 1.0) +
  geom_odum_heat_sink  (data = d[9, ],  width = 0.8, height = 1.0) +
  geom_odum_transaction(data = d[10, ], width = 1.8, height = 0.7) +
  geom_text(aes(y = -1.8, label = role), size = 3) +
  coord_fixed() +
  theme_void()
Design

Under the hood each geom_odum_* extends ggplot2::GeomPolygon and uses an internal .expand_odum() helper to convert each row of data into a set of polygon vertices, then delegates rendering to GeomPolygon. This means every layer supports the full ggplot2 grammar out of the box — facets, animations, palettes, coordinate systems, statistical transformations.
Symbols with multiple sub-polygons (switch, heat_sink) emit their sub-parts as distinct group values so outlines don’t self-cross.
For users who want direct access to the polygon coordinates (e.g. for gganimate transition_states or non-ggplot renderers), the low-level vertex helpers are also exported: odum_circle(), odum_source(), odum_flow(), odum_storage(), odum_consumer(), odum_interaction(), odum_producer(), odum_switch(), odum_self_limiter(), odum_heat_sink(), odum_transaction(), odum_money().
Prior art
A deep scan of CRAN, GitHub, PyPI, and the biennial Emergy Synthesis proceedings found no other grammar-of-graphics ESL library. The closest peers:
- EmSim (Valyi & Ortega 2004) — Java ODE integrator for ESL diagrams, no rendering API, effectively abandoned.
-
sholtomaud/odum-energy-language — TypeScript GUI drag-and-drop editor, no data binding. Sholto Maud also produced the Visio stencil that Wikipedia’s Energese chart is based on — the same chart this package’s
plot_energese_reference()reproduces programmatically. -
University of Florida CEP
- International Society for the Advancement of Emergy Research — reference SVG images, not programmatic stencils.
energese fills the gap: programmatic, data-bindable Odum ESL layers in R’s grammar of graphics.
Related concepts
Odum’s ESL is the visual notation for emergy accounting — a body of ecological-economics theory built on:
- Transformity (sej/J) — the accumulated solar-emergy embodied in one joule of a product; measures energy quality.
- Empower (sej/time) — the rate of emergy flow through a system.
- Maximum empower principle — Odum’s proposed fourth thermodynamic law: systems that self-organise to maximise their power intake dominate under natural selection.
- Emergy hierarchy — the ordering of processes by transformity, from raw sunlight (1 sej/J) up through fuels, food, and information.
If you need to compute those quantities from real fuel-mix and household data, see the sibling package emburden ecosystem, which uses energese for diagrams and provides its own emergy pipeline.
Citation
If you use energese in academic work, please cite:
Scheier, E. (2026). energese: ggplot2 Layers for H.T. Odum’s Energy Systems Language. R package version 0.1.0. https://github.com/ericscheier/energese
Please also cite the canonical Odum references shipped in inst/CITATION:
- Odum, H.T. & Pigeon, R.F. (eds.) (1970). A Tropical Rain Forest: A Study of Irradiation and Ecology at El Verde, Puerto Rico.
- Odum, H.T. (1994). Ecological and General Systems: An Introduction to Systems Ecology. Rev. ed. University Press of Colorado.
- Odum, H.T. & Odum, E.C. (2000). Modeling for All Scales. Academic Press.
- Odum, H.T. (2007). Environment, Power, and Society for the Twenty-First Century: The Hierarchy of Energy. Columbia University Press.
- Brown, M.T. (2004). “A picture is worth a thousand words: Energy systems language and simulation.” Ecological Modelling 178: 83–100. https://doi.org/10.1016/j.ecolmodel.2003.12.008
Attribution
Visual geometry validated against Wikipedia’s Energese reference chart, originally produced as a Microsoft Visio stencil by Sholto Maud.